Behavioral and Questionnaire-Based Analysis of Auditory Processing Disorder in Korean Patients
한국의 청각처리장애 환자에 대한 행동 검사 및 설문 기반 분석
Article information

Abstract
Background and Objectives
This study examined questionnaire and behavioral test results in Korean individuals with suspected auditory processing disorder (APD) to identify characteristics and estimate possible lesion sites of the disease.
Subjects and Method
Fifty participants with symptoms of APD and 36 age-matched controls with normal hearing and cognition were included. A 25-item APD questionnaire (total score: 100) was developed based on established guidelines and scales. Behavioral tests included a dichotic 3-digit test, a dichotic consonant-vowel test, a frequency pattern test, a temporal modulation detection (TMD) test, a time-compressed speech test, and a speech-in-noise test. APD was diagnosed when participants scored more than 2 standard deviations below the mean in at least two test domains.
Results
Of the 50 participants, 40 (mean age 38.18±10.82 years; M:F=14:26) were diagnosed with APD (APD+). Both APD+ and APD- groups scored significantly higher on the questionnaire than controls (p<0.001), but there was no difference between the APD+ and APD- groups. All behavioral tests except the TMD test showed significantly poorer performance in the APD+ group than the controls (p<0.001). Questionnaire scores correlated well with most behavioral test scores. Estimated lesion sites included the right auditory cortex (13), right auditory cortex or corpus callosum (6), left auditory cortex (4), left auditory cortex or corpus callosum (2), corpus callosum (3), and 12 indeterminate sites.
Conclusion
A substantial proportion of individuals reporting APD symptoms met the diagnostic criteria. The right auditory cortex may be a frequent lesion site, but further studies are needed to clarify the neural basis.
Introduction
Auditory processing disorder (APD) refers to a hearing disorder caused by abnormalities in the processing of auditory stimuli along efferent or afferent pathways of the central auditory system, excluding the peripheral auditory system, namely within the brainstem, cerebral cortex, and interhemispheric connections. This disorder is characterized by difficulty in recognizing linguistic and non-linguistic sounds despite normal hearing thresholds on pure-tone audiometry. The reported prevalence ranges from approximately 0.5% to 7%, and it has been reported to be higher in males [1]. APD patients experience difficulties particularly in understanding speech in noise, sound localization, identifying sound patterns, and detecting temporal changes. Due to these characteristics, they often show abnormal responses even in everyday listening situations [2,3]. For example, in environments with background noise or in highly reverberant environments, speech recognition markedly decreases, and attention to auditory information also tends to decline [4]. These features overlap with symptoms of dyslexia, developmental language disorder, attention-deficit/hyperactivity disorder, and autism spectrum disorder, which can lead to misdiagnosis or comorbidity [5]. Therefore, establishing specific and standardized diagnostic criteria to clearly differentiate APD is important.
Several international academic societies, including the American Academy of Audiology (AAA), have proposed behavioral tests for APD diagnosis, which are generally categorized into four major categories: 1) dichotic listening tests, 2) temporal processing tests, 3) monaural low redundancy tests, and 4) binaural interaction tests [6-9]. The AAA recommends diagnosing APD when performance scores of one ear are more than 2 standard deviations below the mean in two or more behavioral test measures. In contrast, the Canadian Interorganizational Steering Group for Speech-Language Pathology and Audiology uses diagnostic criteria of a decline of 2 standard deviations or more in two or more test measures, or 3 standard deviations or more if only a single measure is abnormal [6,10]. A study in the Japanese Journal of Audiology reported that diagnosis may also be possible when one or more behavioral test measures are more than 2 standard deviations below the mean [11,12].
In addition, considering reduced attention and accumulated fatigue in test participants, it has been recommended that total test time be limited to within 45-60 minutes with a minimal set of tests, and that two tests within the same category be performed to improve diagnostic accuracy [6]. However, in the clinical setting, clear guidance is lacking regarding which measures should be selected and combined within these test categories and how many tests are appropriate. Although many studies exist for individual tests, studies integrating them and validating them as a single diagnostic protocol are rare. Because APD includes clinically meaningful auditory functional impairment that can affect daily life and occupational performance, there is also a need to develop a questionnaire that can comprehensively assess auditory processing ability, attention, and language function. In Korea, however, a useful questionnaire for screening APD has not yet been developed.
Accordingly, this study aimed to develop a Korean screening questionnaire for APD and to analyze the questionnaire results, together with behavioral test results, to assess the diagnostic potential of APD, characterize patients, and identify predicted lesion sites.
Subjects and Methods
Subjects
This study enrolled adults who perceived symptoms of APD. A total of 50 participants in the suspected APD group (36.98±10.88 years; M:F=18:32) and 36 age- and sex-matched normal controls (33.44±8.29 years; M:F=13:23) were recruited.
Among the 50 suspected APD participants, 8 were patients who voluntarily reported the symptoms and visited the outpatient clinic, and the remaining 42 were recruited by posting a poster containing APD-related symptom items on a community-based online platform (Supplementary Material 1) and screening applicants who endorsed 4 or more of the 5 presented symptom items. Normal controls consisted of individuals who did not report any subjective APD-related symptoms, and they were recruited to match the age and sex of the suspected APD group. All participants were between their teens and 60s and were included only if they met the following criteria: 1) bilateral hearing thresholds within 20 dB HL on pure-tone audiometry, 2) wave V latency within 6.29 ms on auditory brainstem response at 90 dB HL stimulation, which corresponds to the mean value in normal-hearing individuals plus 2 standard deviations [13], 3) normal bilateral responses on distortion product otoacoustic emission testing, 4) no structural abnormalities of the tympanic membrane and external auditory canal, and 5) Mini-Mental State Examination score of 27 or higher with no cognitive impairment.
Participants were excluded if they met any of the following conditions: 1) inconsistent or unstable hearing test results, 2) underlying diseases that could cause hearing loss such as otitis media or Meniere disease, 3) cognitive ability insufficient to adequately follow the test instructions, and 4) left-handedness (excluded in consideration of functional auditory lateralization). Of 54 initially recruited suspected APD participants, 4 were excluded based on exclusion criteria, and 50 were finally included in the suspected APD group.
This study was conducted in accordance with the Declaration of Helsinki and the recommendations of the Institutional Review Board of Nowon Eulji Medical Center, and written informed consent was obtained from all participants (2024-02-021).
Development of the Korean APD (K-APD) questionnaire
The questionnaire consisted of 25 items. Each item was scored from 0 to 4 points, and the total score was set to a maximum of 100 points. Based on item content, the questionnaire comprised 4 items in the noise domain, 9 items in the understanding domain, 6 items in the learning domain, 4 items in the location domain, and 2 items in the discrimination domain. These items were extracted from previously published questionnaires for evaluating APD and were reconstructed in Korean. Specifically, 8 items were selected from the AAA Clinical Practice Guidelines [6], 7 items from the Auditory Processing Domains Questionnaire (APDQ) [14], and 10 items from the Speech, Spatial and Qualities of Hearing Scale (SSQ) [15]. Items based on AAA and APDQ were machine-translated and then revised by the study team according to context and meaning. For SSQ items, the Korean version of the SSQ (K-SSQ), which was officially translated and validated for reliability and validity by the questionnaire committee under the Korean Audiological Society, was used [16]. The final questionnaire used in this study is presented in Supplementary Material 2.
Behavioral tests
The behavioral test battery included two tests selected from each of three categories: 1) dichotic listening tests, 2) temporal processing tests, and 3) monaural low redundancy tests, resulting in a total of six tests. To construct a time-efficient battery within the recommended 45-60 minutes, we selected these three categories (excluding binaural interaction tests). The battery included a dichotic 3-digit test, a dichotic consonant-vowel (CV) test, a frequency pattern test (FPT) (humming/labeling), a temporal modulation detection (TMD) test, a time-compressed speech test, and a speech-in-noise test. The detailed configuration, procedures, and interpretation of the tests are presented in Table 1.
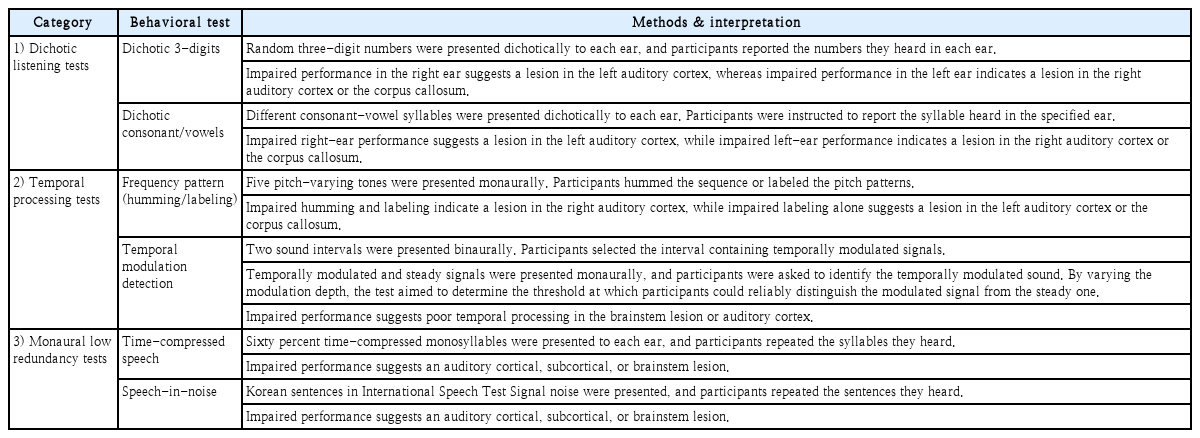
Behavioral test: categories, methods, and interpretation
All tests except the speech-in-noise test were conducted in a soundproof booth while participants wore ER-3A insert earphones (Etymotic Research), and the presentation level was set at 60 dB HL, a level the participants perceived as comfortable. For the speech-in-noise test, stimuli were presented through a loudspeaker (Yamaha Corporation), and the contralateral ear (the ear not receiving the stimulus) was masked using earplugs (BILSOM 303L, Honeywell) and headphones (HDA 200, Sennheiser).
Dichotic 3-digit test
To evaluate dichotic listening ability, this study used a Korean dichotic digit test previously developed through earlier studies [17,18]. The originally developed test was standardized with pairs of one-, two-, and 3-digit numbers, but in this study, 3-digit number pairs were used considering task difficulty and discriminability [19]. Each test comprised 20 items. The inter-digit interval was 500 ms, and the inter-item interval was 5 seconds. Participants were instructed to verbally report all numbers heard simultaneously in both ears in a free-response manner. An item was scored as correct when all 3 digits presented from each side were correctly reported. Scores were calculated separately for the right ear and left ear as the number of correct items.
Dichotic CV test
A total of 14 Korean CV syllables (for example, /ga/, /na/, /da/) were recorded by a female talker in a soundproof booth using a lavalier microphone (BY-WMA4 PRO K3, BOYA). All stimuli were sampled at 44100 Hz, and the overall root mean square amplitude was normalized to -22 dB using Adobe Audition version 1.5 (Adobe Systems Inc.). To ensure that syllables did not repeat within a syllable pair, a custom MATLAB R2023a (MathWorks Inc.) script using a random number generation function created 14 syllable pairs. The algorithm was designed to automatically regenerate any pair if it contained a duplicate syllable or was identical to a previously generated pair, resulting in all final pairs consisting of different syllables (for example, right: /ga/, left: /da/). The inter-pair interval was set to 2 seconds.
Participants listened to a total of 30 syllable pairs presented dichotically and were instructed to repeat aloud only the syllable perceived in the designated ear (for example, “Different syllables will be heard in both ears, but please repeat only the syllable heard in the right ear.”). This was conducted as a trial-by-trial response procedure. The same procedure was then repeated for the opposite ear, and if the right ear was assessed first, an additional 30 syllable pairs were presented for the left ear assessment. For each ear, the number of correct responses out of 30 trials was recorded [20].
FPT
The FPT evaluates the ability to determine temporal order and assesses the integrity of interhemispheric and hemispheric neural information transfer [21]. Five consecutive tones were presented to participants, each tone being either a high (1122 Hz) or low (880 Hz) frequency. Testing was performed separately in each ear. Participants responded using either humming (humming along to indicate high and low) or labeling (naming the tone as “high” or “low”). The duration of each tone was 150 ms with 10 ms rise and fall times and a 200 ms inter-tone interval.
The FPT consisted of 60 items, divided into 30 items for humming and 30 items for labeling. The sequence was designed so that the same tone was not presented three or more times consecutively. A total of 30 possible patterns were presented evenly across four conditions (left ear humming, left ear labeling, right ear humming, right ear labeling), with 15 items per condition. For both humming and labeling, the number of correct responses per ear (total score 15 points per condition) was calculated separately.
TMD test
The TMD test, which measures sensitivity to perception of temporal envelope cues, was conducted using the method adopted in the study by Won, et al. [22]. Participants were instructed to press a button when they heard an amplitude-modulated noise presented sequentially with a steady noise (two-interval task). Testing was performed separately for each ear: in each trial, the steady noise and the amplitude-modulated noise were presented consecutively to the test ear, and participants responded when the modulated noise was perceived. The modulated noise was generated on each run using a different broadband white noise as the carrier with sinusoidal amplitude modulation applied, and the modulation frequency was set to 100 Hz. The modulated and steady noises were presented consecutively without an inter-stimulus interval. Each had a duration of 1 second, and a 10 ms linear ramp was applied at both ends to allow gradual onset and offset. The order of modulated and steady noise presentation was randomized on each trial.
The TMD threshold was measured using a two-down one-up procedure. The threshold was expressed as a relative value (dB) referenced to 100% modulation, that is, 20log10(mi), where mi denotes the modulation index. The adaptive tracking procedure began at 100% modulation depth. Modulation depth was adjusted in 4 dB steps from the first to the fourth reversal point, and then in 2 dB steps for the subsequent 10 reversal points. The threshold for each adaptive test run was calculated as the mean of the final 10 reversal points. The final TMD threshold was determined as the average of values obtained from three independent runs.
Time-compressed speech test
The time-compressed speech test is a monaural low redundancy test that evaluates auditory closure, the ability to infer meaning from limited speech information. Two lists of 50 phonemically balanced words selected from the Korean standard monosyllabic word lists for adults were used (KS-MWL-A list 1 and list 2) [23]. There were no overlapping words between the two lists. All words were time-compressed to 60% of their original duration using MATLAB R2023a (MathWorks Inc.). A 60% compression ratio has been suggested in previous studies as a ratio that effectively increases task difficulty in evaluating temporal auditory processing while maintaining clarity of the assessment [24]. Recorded speech was saved at 44100 Hz, and the overall root mean square amplitude was normalized to -22 dB using Adobe Audition version 1.5 (Adobe Systems Inc.). In this test, list 1 was fixed to the right ear and list 2 to the left ear. Participants were required to listen to and repeat aloud each of the 50 words in each list, and the number of correctly repeated words was recorded separately for each ear.
Speech-in-noise test
To measure speech recognition in noise, the Korean Matrix sentence recognition test was used [25-27]. All Korean Matrix sentences are semantically unpredictable but share the same grammatical structure (noun, adjective, object, numeral, verb). This is because each sentence is generated using a 5×10 base word list (10 nouns, 10 adjectives, 10 nouns, 10 numerals, 10 verbs). General principles and applications of the Korean Matrix sentence recognition test have been described in detail in previous studies [28-30].
In this test, International Speech Test Signal (ISTS) noise was used. ISTS noise is a non-speech noise generated by randomly recombining segments (100-600 ms) of speech from six female talkers reading “The North Wind and the Sun” story in six languages. The Korean Matrix sentence recognition test was performed using Oldenburg Measurement Applications (HörTech gGmbH). Test sentences and noise were presented through a Fireface UCX digital-to-analog converter (RME Audio Interfaces), and stimuli were delivered through a speaker located 1 m in front of the participant. During testing, the noise level was fixed at 65 dB SPL, and the sentence level was adjusted according to participant responses based on maximum likelihood estimation [31]. As a result, the signal-to-noise ratio required to achieve 50% recognition was measured, and the 50% speech reception threshold was calculated.
Diagnostic criteria for APD
Poor performance for each behavioral test measure was defined as a score less than or equal to the mean score of the 36 normal controls minus 2 standard deviations (Table 2). APD was diagnosed when poor performance occurred in at least two behavioral test categories. This differs from the AAA guideline, which allows diagnosis based on two or more abnormal measures regardless of test category [6], whereas our criterion required abnormalities across two or more categories.
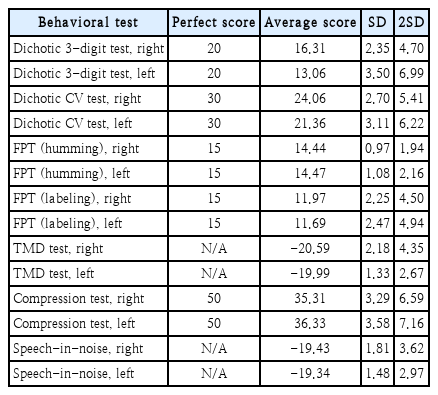
Average, SD, 2SD of the normal control group for each behavioral test measure
Statistical analysis
Statistical analyses were performed using SPSS statistical software (version 30; IBM Corp.). For measures satisfying normality, analysis of variance and Bonferroni post hoc tests were performed (significance level p=0.05). For measures not following normality, the non-parametric Kruskal-Wallis test was used, and the Mann-Whitney U test was used for post hoc comparisons. The Bonferroni method was applied to correct for multiple comparisons (corrected significance level p=0.0167). In addition, correlations between the total questionnaire score and behavioral test scores were examined using Pearson correlation analysis.
Lesion site estimation
For the dichotic 3-digit test, dichotic CV test, and FPT—tests that allow inference of lesion laterality and region based on behavioral outcomes—lesion site estimation was performed as follows. When a participant’s test score was more than 2 standard deviations below the mean, the brain region associated with that deficit was used as evidence for lesion inference. The primary estimate was the intersection of lesion sites suggested by the three tests. As an exception, when the dichotic 3-digit and dichotic CV inferences conflicted, we first took the union of those two inferences and then intersected it with the FPT inference. When inferred directions (left/right) conflicted across tests and there was no intersection across categories, the case was classified as indeterminate.
Results
Applying these criteria, 40 of the 50 participants with suspected APD (38.18±10.82 years; M:F=14:26) were diagnosed with APD (APD+ group), whereas the remaining 10 did not meet the diagnostic criteria and were classified as the APD-group (32.20±10.28 years; M:F=4:6).
There were no significant differences in age or sex among the APD+, APD-, and normal control groups (p>0.05). Using the four-frequency average (500, 1000, 2000, 4000 Hz), the pure-tone average thresholds were 10.63±3.29 dB HL in the right ear and 9.91±4.42 dB HL in the left ear for the APD+ group, 8.38±3.23 dB HL in the right ear and 9.75±4.78 dB HL in the left ear for the APD- group, and 9.93±3.38 dB HL in the right ear and 9.03±3.73 dB HL in the left ear for the normal control group, with no statistically significant differences among groups (p>0.05). For auditory brainstem responses, wave V latencies were 5.54±0.25 ms in the right ear and 5.46±0.29 ms in the left ear for the APD+ group, 5.54±0.19 ms in the right ear and 5.47±0.18 ms in the left ear for the APD- group, and 5.53±0.15 ms in the right ear and 5.52±0.19 ms in the left ear for the normal control group, again showing no statistically significant differences among groups (p>0.05).
K-APD questionnaire results
In the questionnaire assessing subjective discomfort or difficulties related to auditory processing, questionnaire scores were higher in the APD+ group (50.18±17.39) and the APD-group (53.00±16.57) than in the normal control group (19.97±12.40) (all p<0.001), with no difference between the APD+ and APD- groups (p>0.05). When comparing five subdomains including noise, understanding, learning, location, and discrimination, both the APD+ and APD- groups reported significantly greater difficulties across all subdomains than the normal control group (all p<0.001). However, no statistically significant differences were observed between the APD+ and APD- groups in any subdomain (Fig. 1).
Comparisons of the questionnaire results among the three groups. Significant group differences were observed across all domains, with both the APD+ and APD- groups demonstrating significantly higher questionnaire scores compared to the normal group. The boxes represent the interquartile range (IQR; 25th–75th percentiles), with the horizontal line indicating the median and the ‘× marker indicating the mean value. The whiskers extend to the smallest and largest values within 1.5×IQR from the lower and upper quartiles, respectively. Individual dots represent outliers beyond this range. ***p<0.001.
Among 86 participants (50 suspected APD participants and 36 controls), 40 were diagnosed with APD based on behavioral testing. Using questionnaire scores, a receiver operating characteristic curve was generated. The area under the curve was 0.81, indicating that questionnaire scores showed discriminative ability to meaningfully distinguish patients from the normal group. The optimal cut-off score calculated based on the Youden index was 35 points, with sensitivity of 82.5% and specificity of 73.9% at this criterion.
Behavioral test results
Among the six behavioral tests, excluding the TMD test, the APD+ group showed significantly poorer performance than the normal control group on the dichotic 3-digit test, dichotic CV test, FPT (humming/labeling), time-compressed speech test, and speech-in-noise test (Fig. 2).
Comparison of behavioral test results between the three groups. Normal group showed significantly better performance than the APD+ group in both ears on the dichotic 3-digit test (both ears, p<0.001), dichotic consonant/vowel (CV) test (both ears, p<0.001), frequency pattern test (FPT) (humming in both ears, p<0.001, labeling in both ears, p<0.001), time-compressed speech (compression) test (both ears, p<0.001), and speech-in-noise test (both ears, p<0.001). The temporal modulation detection (TMD) test was the only test that showed no significant differences between the groups in both ears. Moreover, significantly better performance was observed in the APD group compared to the APD+ group on the right-ear dichotic CV test, right-ear time-compressed speech test and the right-ear speech-innoise test (p=0.004, p=0.002, p=0.036 respectively). *p<0.05; **p<0.01; ***p<0.001.
Dichotic 3-digit test
The APD+ group showed lower correct response rates in both ears than the normal control group (both ears p<0.001). There were also significant differences between the APD-group and the normal control group (right p=0.004, left p<0.001). No significant differences were observed between the APD+ and APD- groups in either ear.
Dichotic CV test
The APD+ group showed lower correct response rates in both ears than the normal control group (both ears p<0.001). The APD+ group showed a lower correct response rate than the APD- group only in the right ear (p=0.004). There were no significant differences between the APD- group and the normal control group in either ear.
FPT (humming/labeling)
For humming responses in both ears, the APD+ group showed lower correct response rates than the normal control group (both ears p<0.001), but there were no significant differences between the APD+ and APD- groups or between the APD- group and the normal control group. For labeling responses, the APD+ group showed lower correct response rates in both ears than the normal control group (both ears p<0.001), and the APD- group also showed a lower correct response rate than the normal control group in the left ear (p=0.011).
TMD test
In the Kruskal-Wallis test, no significant differences in performance among groups were observed in either ear.
Time-compressed speech test
The APD+ group showed lower correct response rates than the normal control group in both ears (both ears p<0.001). The APD+ group showed a lower correct response rate than the APD- group only in the right ear (p=0.002). There were no significant differences between the APD- group and the normal control group in either ear.
Speech-in-noise test
The APD+ group showed lower correct response rates than the normal control group in both ears (both ears p<0.001). The APD+ group showed a lower correct response rate than the APD- group only in the right ear (p=0.036). There were no significant differences between the APD- group and the normal control group in either ear.
Correlations between behavioral test results and questionnaire scores
Significant correlations were observed between questionnaire scores and all behavioral test results except the TMD test (right r=0.156, p=0.244; left r=0.056, p=0.679) (Supplementary Table 1 and Fig. 3). Specifically, correlations were as follows: dichotic 3-digit test (right r=-0.452, p<0.001; left r=-0.417, p<0.001), dichotic CV test (right r=-0.361, p=0.001; left r=-0.408, p<0.001), FPT (humming, right r=-0.242, p=0.025; left r=-0.222, p=0.040), FPT (labeling, right r=-0.437, p<0.001; left r=-0.461, p<0.001), time-compressed speech test (right r=-0.529, p<0.001; left r=-0.562, p<0.001), and speech-in-noise test (right r=0.358, p=0.001; left r=0.326, p=0.004).
Correlations between questionnaire scores and the behavioral test results In both ears, a statistically significant negative correlation was observed in the dichotic 3-digit test (right r=-0.452, p<0.001, left r=-0.417, p<0.001), dichotic consonant/vowel (CV) test (right r=-0.361, p=0.001, left r=-0.408, p<0.001), frequency pattern test (FPT) (humming, right r=-0.242, p=0.025, left r=-0.222, p=0.040), FPT (labeling, right r=-0.437, p<0.001, left r=-0.461, p<0.001), and time-compressed speech (compression) test (right r= -0.529, p<0.001, left r=-0.562, p<0.001). Also, speech-in-noise test (right r=0.358, p=0.001, left r=0.326, p=0.004) showed significant positive correlation in both ears. The temporal modulation detection (TMD) test (right r=0.156, p=0.244, left r=0.056, p=0.679) did not show a significant correlation in both ears.
Lesion site estimation
The estimated lesion sites based on reduced behavioral test performance were as follows: right auditory cortex in 13 participants, right auditory cortex or corpus callosum in 6 participants, left auditory cortex in 4 participants, left auditory cortex or corpus callosum in 2 participants, corpus callosum in 3 participants, and indeterminate lesion sites in 12 participants.
Discussion
This study was conducted to systematically evaluate symptoms related to APD by developing a questionnaire that can be used for screening and to construct a behavioral test battery to diagnose APD and predict lesion sites in adults who perceived symptoms similar to APD.
In the K-APD questionnaire results, both the APD+ and APD- groups showed significantly higher scores than the normal control group, but there was no significant difference between the APD+ and APD- groups. This can be understood as reflecting that participants were recruited based on self-reported symptoms, resulting in no difference between the APD+ and APD- groups on a questionnaire asking the degree of subjective discomfort related to auditory processing. This suggests that self-reported symptoms alone are insufficient to diagnose APD. However, the strong correlations between most behavioral tests and the questionnaire results suggest that the K-APD questionnaire may be valid as a screening test to determine whether individuals reporting APD symptoms should proceed to confirmatory testing. Further validation of reliability and validity of this questionnaire and establishment of a questionnaire score threshold are expected to support clinical application as an APD screening tool.
Among behavioral tests used for diagnosing APD, the dichotic 3-digit test and the dichotic CV test are known to be sensitive to auditory cortex and corpus callosum lesions and to allow laterality determination [32,33]. Reduced right-ear performance is interpreted as related to a lesion in the left auditory cortex, whereas reduced left-ear performance is interpreted as related to a lesion in the right auditory cortex or corpus callosum. The dichotic CV test has been reported to have higher stimulus complexity than the dichotic digit test, impose a greater linguistic processing load, and show a more distinct right-ear advantage [34]. Due to these characteristics, it may be useful for assessing subtle abnormalities in central auditory processing, but potential increases in errors due to similarity between stimuli and lack of contextual cues should also be considered. In contrast, the dichotic digit test has high test reliability due to simplicity and familiarity of number stimuli, but it may have limited sensitivity for detecting mild auditory processing abnormalities due to low discriminability among stimuli [34-36].
For the FPT, reduced performance in both humming and labeling suggests a right auditory cortex lesion, whereas reduced labeling alone suggests a left auditory cortex or corpus callosum lesion [37-39]. Therefore, combining these test results can allow estimation of the most likely lesion site and laterality. The TMD test evaluates temporal resolution and temporal modulation signal detection ability, and poor performance may raise suspicion for lesions in the auditory cortex and brainstem [40]. However, in this study, TMD test results were mostly distributed within the normal range, indicating low diagnostic sensitivity. Accordingly, the TMD test may need to be excluded from the test battery or improved in future work.
The time-compressed speech test and the speech-in-noise test measure auditory closure, the ability of the brain to accurately understand and restore unclear or partially missing sound information using experience, context, and linguistic knowledge [41]. However, because prior studies providing evidence to infer lesion laterality from these two tests are lacking, they were not included in lesion laterality estimation in this study.
The APD+ group showed significantly poorer performance than the normal control group on all behavioral tests except the TMD test. In particular, the dichotic CV test, time-compressed speech test, and speech-in-noise test showed significant differences between the APD+ and APD- groups in the right ear, and these measures are therefore considered tests with very high specificity for APD diagnosis. The fact that all three tests showed significant differences between the APD+ and APD- groups only in the right ear is presumed to reflect that all three tests use speech stimuli and are influenced by left-hemisphere language dominance [38,42]. In addition, although no significant difference was observed between the APD+ and APD- groups on the dichotic 3-digit test, the APD- group showed significantly poorer performance than the normal control group, suggesting that APD discriminability may be relatively limited compared with the dichotic CV test.
This study was conducted with a relatively large sample among APD studies performed in Korea (50 suspected APD participants and 36 normal controls) and is meaningful in that it reflected diverse test categories. Limitations include that this was a single-center study and that only three of the four behavioral test categories were included. Future studies should establish a more comprehensive diagnostic protocol through multicenter collaboration and inclusion of additional test measures. In addition, there is a need to verify lesion site prediction based on behavioral test results by linking this approach with neuroimaging-based research.
Supplementary Materials
Korean translation of this article is available with the Online-only Data Supplement at https://doi.org/10.3342/kjorl-hns.2025.00430.
The Supplement is available with this article at https://doi.org/10.3342/kjorl-hns.2025.00430.
Notes
Acknowledgments
This paper was supported by Eulji University in 2024 (EJBS-24-04).
Author Contribution
Conceptualization: Hyun Joon Shim, Yong-Hwi An. Data curation: Jung-A Kim, Hyo Jung Choi. Formal analysis: Jung-A Kim, Hyo Jung Choi. Funding acquisition: Hyun Joon Shim. Methodology: all authors. Supervision: Hyun Joon Shim. Writing—original draft: Jung-A Kim, Hyo Jung Choi. Writing—review & editing: Hyun Joon Shim, Jung-A Kim.