


Introduction
The olfactory pathway is stimulated when odor molecules are dissolved in the mucus covering the olfactory neuroepithelium, mainly in the roof of the nasal cavity, superior turbinate, and upper part of the nasal septum. Bound to odorant-binding proteins, they then migrate to the ciliary body of olfactory receptive cells, which transmits the signal to the olfactory cortex [1]. Dysfunction of olfaction can be caused by obstructive sinonasal disease, such as chronic rhinosinusitis (CRS) with or without nasal polyps, upper respiratory tract infection, head trauma, chemical injury, aging, endocrine-metabolic disorders, neurodegenerative and neurologic diseases, tumors, congenital disorders, iatrogenic causes, and psychiatric diseases [2].
Olfactory dysfunction is one of the cardinal diagnostic symptoms of CRS. A decreased sense of smell can markedly affect CRS patientsŌĆÖ health-related quality of life [3,4]. Although it is known that CRS-related olfactory impairment may be caused by a combination of mechanical obstruction, due to edematous mucosa or polyposis near the olfactory cleft, and neurologic damage to the olfactory mucosa, due to chronic inflammatory responses, the pathogenesis of olfactory dysfunction in CRS is not well understood [5].
The prevalence and degree of CRS-related olfactory dysfunction vary widely. Moreover, patients who present similar total scores on olfactory function tests show various levels of olfactory impairment in each of the test domains, including threshold, discrimination, and identification. Thus, multiple factors might affect olfaction. At present, overall disease severity measured by computed tomography (CT) and nasal endoscopy is considered as one of affecting factors [6-9]. The degree of opacification on CT scans, determined by the Lund-Mackay staging system, correlates with olfactory identification [3]. Additionally, opacification of the olfactory cleft, where most olfactory receptor neurons are located, is particularly closely related to olfactory dysfunction [6]. In addition, both the severity of CRS on CT and the Lund-Kennedy endoscopic score are significant risk factors for CRS-related olfactory impairment [7-9]. However, previous studies have yielded discrepant findings about factors affecting olfactory function in CRS. Additionally, little research has been conducted on the relationships among the different olfactory function domains. Furthermore, risk factors related to poor threshold, discrimination, and identification scores have not been established to date.
We sought to identify the relationship among threshold, discrimination, and identification scores in CRS patients who showed similar overall olfactory impairment on an olfactory function test. Furthermore, we comprehensively investigated the risk factors that impact each individual domain of the olfactory function test in patients with CRS.
Subjects and Method
Subjects
CRS patients who underwent endoscopic sinus surgery and showed olfactory dysfunction on a pre-operative olfactory function test were enrolled from Kyung Hee University Hospital between September 2014 and February 2018. All CRS subjects met clinical criteria for CRS as defined by the American Academy of Otolaryngology-Head and Neck Surgery Chronic Rhinosinusitis Task Force [10,11]. In addition, enrolled patients were received oral corticosteroid 10 mg per day for 2 weeks with intranasal corticosteroid spray treatment for 2 weeks preoperatively for medical treatment of olfactory impairment. All patients provided a medical history and underwent nasal endoscopy, allergy tests, olfactory function test, and CT. Age, gender, phenotypes of CRS, history of smoking and alcohol, which has been considered as clinical factors associated with olfactory dysfunction, were investigated through medical records [12]. Skin prick test, multiple allergen simultaneous test (MAST), and specific IgE (sIgE) blood test by Immunocap were performed. Diagnostic results included a positive allergy skin tests or MAST or ImmunoCAP test indicating the presence of sIgE antibodies to aeroallergens. Patients with allergic fungal sinusitis, fungal sinusitis, head trauma, recent upper respiratory infection, neurodegenerative disorders, such as AlzheimerŌĆÖs disease or ParkinsonŌĆÖs disease, nasal surgery, central olfactory damage, such as brain compression, brain hemorrhage, Kallmann syndrome, toxic agent exposure, or brain neoplasms, such as meningioma, were excluded from the study.
Patients were assigned to a hyposmic or anosmic group according to the results of the preoperative olfactory function test. Next, we subdivided these patients according to their threshold, discrimination, and identification scores into higher and lower score groups. All data were reviewed retrospectively.
Olfactory function test
For the olfactory function test, the Korean version of the SniffinŌĆÖ Sticks test II (KVSS Test II) (Burghart Company, Wedel, Germany) was used [13]. KVSS Test II consists of an olfactory threshold test, odor discrimination test, and odor identification test. Olfactory threshold and odor discrimination tests were performed using 16 olfactory test pens and a three-alternatives forced-choice task. The olfactory threshold test consists of 16 olfactory test pens, diluted at a 1:2 ratio at 4% of the maximum concentration of n-butanol. First, the patient smelled pen 1, the highest concentration, to acclimatize to the odor and was then instructed to wait for about 3 minutes to avoid confusion. The test was then started from pen 16, containing the lowest odorant concentration. The subject was presented with three pens, one containing n-butanol and two containing solvent. If a pen containing solvent, but not the pen containing n-butanol, was selected, the test proceeded to the next two-steps higher concentration, consecutively, until the pen with butanol was selected two consecutive times. The test then proceeded to the next one-step lower concentration, until seven turning points were observed. The scores of the last four among the seven turning points were averaged to provide the threshold score.
The odor discrimination test consisted of two pens with the same odor and one pen with a different odor. Patients were asked to select the odor that was different for each odor from 1 to 16, and the number of correct answers was recorded as the discrimination score.
The odor identification test consisted of 16 pens with 16 odors familiar to Koreans. After smelling a pen, the patient chose one of the four options to identify the odor; these included one correct answer and three wrong answers. The number of correct answers was recorded as the identification score [14].
The olfactory threshold, odor discrimination, and odor identification tests each had a maximum of 16 points, with a maximum combined score of 48 points. We defined total scores of less than 16 points as anosmia and a score between 16 and 30 points as hyposmia [14,15]. Since there was no known cut-off value for the threshold, discrimination, and identification tests, we decided the median value of 16 points, thus a score Ōēź8 points was defined as the higher-score group and <8 points as the lower-score group.
CT severity score
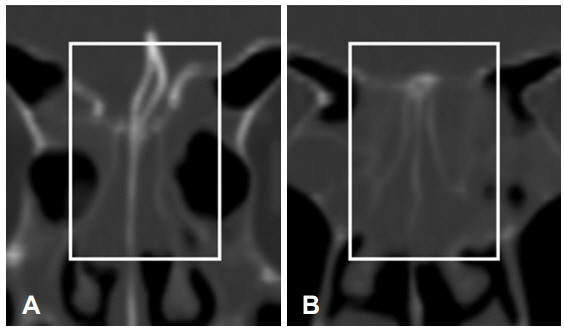
Preoperative CT scans comprised 1-mm-thick paranasal (PNS) images from axial and coronal views, without contrast enhancement, and CT severity was evaluated by olfactory cleft opacification on CT. The olfactory cleft on PNS CT images was bounded anteriorly by anterior attachment of the middle turbinate, posteriorly by the anterior wall of the sphenoid sinus, medially by the nasal septum, laterally by the middle and superior turbinates, superiorly by the skull base superiorly, and inferiorly by the inferior portion of the middle turbinate. The olfactory cleft on CT scans was graded as previously described [16]. Briefly, the olfactory cleft was divided into anterior and posterior parts, based on the anterior end of the superior turbinate (Fig. 1). Anterior olfactory cleft opacification score (AOCS) and posterior olfactory cleft opacification score (POCS) were graded separately on a scale of 0-4, based on the ratio of the opacified area to the whole olfactory cleft area:0 (no opacification), 1 (<25% opacification), 2 (25-50% opacification), 3 (50-75% opacification), and 4 (>75% opacification). Also, we evaluated overall CRS severity on CT scan by using Lund-Mackay scoring system [17].
Nasal endoscopy score
All patients underwent rigid endoscopy to evaluate nasal cavity structure. The nasal endoscopy score was expressed as the polyp grading score using the Meltzer clinical scoring system and the Lund-Kennedy endoscopic score [18,19]. The Meltzer system is a 0-4 polyp grading system (0=no polyps, 1=polyps confined to the middle meatus, 2=multiple polyps occupying the middle meatus, 3=polyps extending beyond the middle meatus, 4=polyps completely obstructing the nasal cavity) [18]. Endoscopic findings were evaluated by scarring, crusting, edema, polyps, and discharge using the Lund-Kennedy endoscopic scoring system (polyps: 0=no polyps, 1=polyps confined to the middle meatus, 2=polyps beyond the middle meatus; edema: 0=no edema, 1=mild edema, 2=severe edema; discharge: 0=none, 1=clear and thin, 2=thick and purulent; scarring: 0=absent, 1=mild, 2=severe; crusting: 0=absent, 1=mild, 2=severe) [19].
Statistical analysis
All data are expressed as means┬▒standard deviations or percentage values. We compared the preoperative nasal endoscopy score, olfactory cleft opacification CT, and other demographic factors, between hyposmia and anosmia groups by using StudentŌĆÖs t-tests and chi-squared tests. Correlations among threshold, discrimination, and identification scores were assessed in both groups using PearsonŌĆÖs correlation coefficients. The high and low scores for threshold, discrimination, and identification groups were compared using the Mann-Whitney U-test and the chi-squared test. Multivariate logistic regression was performed on factors with p values < 0.1 in univariate analysis and results are expressed as adjusted odds ratios and 95% confidence intervals. Statistical analyses were conducted using SPSS version 20.0 statistical software(IBM Corp., Armonk, NY, USA), and p values <0.05 were considered significant.
Results
Subject demographics
PatientsŌĆÖ characteristics are shown in Table 1. Of 404 CRS patients who underwent endoscopic sinus surgery, 120 patients showed olfactory dysfunction on a pre-operative olfactory function test. Of these, 80 patients (66.6%) had hyposmia and 40 patients (33.4%) had anosmia. We found no statistically significant differences in age, sex, history of smoking and alcohol, and phenotypes of CRS between the two groups. In addition, we expected that the prevalence of allergy in the anosmia group might be higher than hyposmia group because allergic rhinitis could influence on the olfactory function in patients with CRS, but there was no difference in the presence of allergy between the two groups (p>0.05) (Table 1). The mean total score and individual component scores on preoperative KVSS II were higher in the hyposmia than in the anosmia group (p<0.01, all). Additionally, in both groups, although postoperative olfactory function test scores were significantly higher than the preoperative olfactory function test scores; there was no significant difference in the degree of improvement in olfactory function scores between the two groups when the analysis was adjusted for preoperative olfactory function test scores (data not shown). The polyp grading score was significantly higher in the hyposmia than in the anosmia group (p<0.01). Similarly, Lund-Kennedy endoscopic scores were significantly higher in the hyposmia than in the anosmia group (p<0.05, all). However, we found no statistically significant differences in Lund-Mackay score between the two groups (p>0.05) (Table 1). When we analyzed the olfactory cleft opacification score from CT scans, both the AOCS and POCS were significantly higher in the anosmia than in the hyposmia group (p<0.05) (Table 1).
Correlation among threshold, discrimination, and identification scores in the hyposmia and anosmia groups
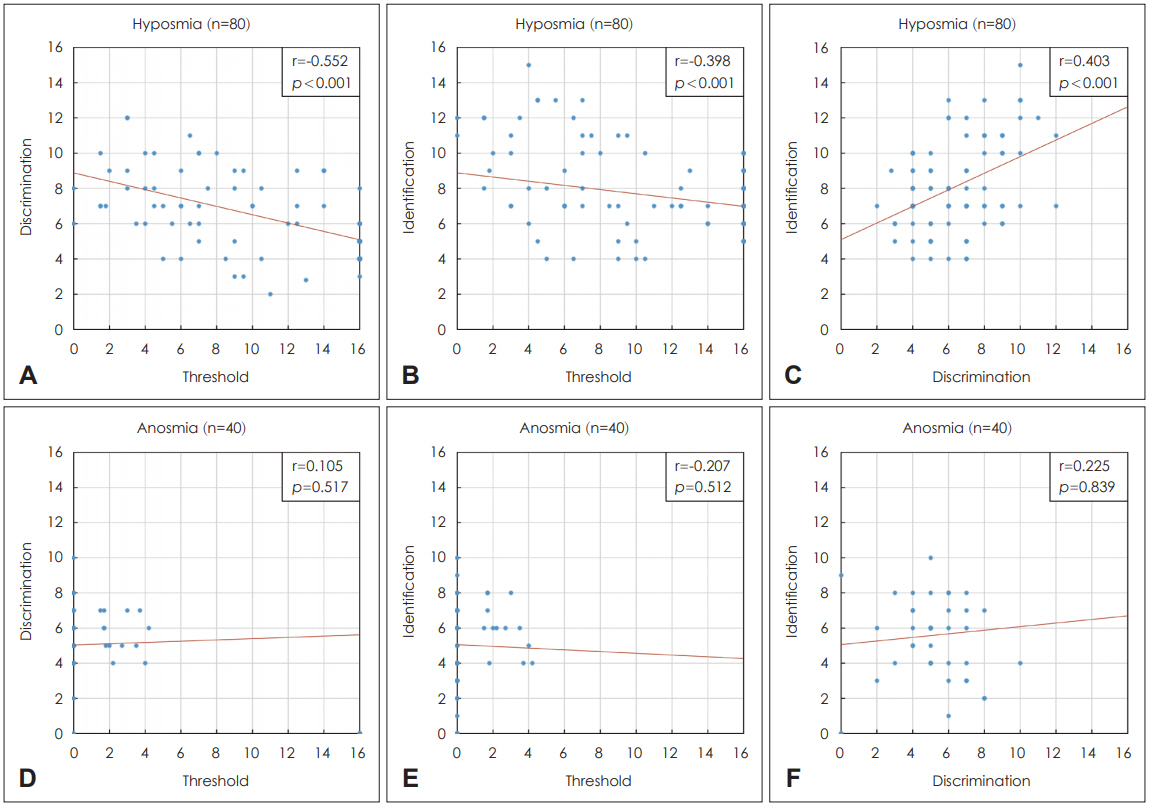
In the hyposmia group, threshold was negatively correlated with discrimination and identification, while the discrimination and identification scores were positively correlated with each other in the hyposmia group (p<0.05 all) (Fig. 2A-C). However, there was no significant correlation among threshold, discrimination, and identification in the anosmia group (p>0.05 all) (Fig. 2D-F).
Risk factors related to olfactory threshold, discrimination, and identification scores in the hyposmia group
We next sought to identify the risk factors affecting each component of the olfactory function test in hyposmia group. First, we assessed factors affecting the threshold score (Table 2). Of 80 patients, 47 (58.8%) were assigned to the higher threshold score group and 33 (41.2%) to the lower threshold score group. In univariate analysis, patients in the higher threshold score group were older than those in the lower threshold score group (p<0.01) (Table 2). In multivariate logistic regression analysis, a similar trend was observed, with younger individuals more likely to belong to the lower threshold score group (p<0.01) (Table 2).
As shown in Table 3, 25 hyposmic patients (31.3%) were assigned to the higher discrimination score group and 55 (68.7%) to the lower discrimination score group. In univariate analysis, the Lund-Kennedy endoscopic crusting score was higher in the lower than in the higher discrimination score group (p<0.01). In multivariate logistic regression analysis, the Lund-Kennedy endoscopic crusting score tended to influence the threshold, but without statistical significance (p=0.07) (Table 3).
Lastly, we analyzed factors affecting identification scores (Table 4). Forty-one hyposmic patients (51.3%) were assigned to the higher identification score group and 39 (48.7%) to the lower identification score group. Univariate analysis demonstrated that the patients in the lower identification score group had higher Lund-Kennedy endoscopic scores for polyps (p=0.01), edema (p<0.01), and discharge (p<0.01) (Table 4). Also, smoking (p=0.06), alcohol (p=0.08), and the Lund-Mackay score (p=0.09) tended to influence the identification. Unlike the threshold and discrimination scores, the AOCS differed significantly between higher and lower identification score group (p=0.03). In multivariate logistic regression analysis, a similar trend was only found in AOCS, with patients who had higher AOC tended to belong to the lower identification score group (p=0.02) (Table 4).
Risk factors related to olfactory threshold, discrimination, and identification scores in the anosmia group
Among anosmic patients, 3 patients (7.5%) had a higher threshold score and 37 patients (92.5%) had a lower threshold score. Univariate analysis showed that the lower threshold score group had a higher Lund-Kennedy polyp score (p<0.01) (Table 5) and POCS than the higher threshold score group (p<0.01) (Table 5). In multivariate logistic regression, as the POCS increased, the probability of belonging to the lower threshold score group increased (p=0.04) (Table 5).
Regarding discrimination scores (Table 6), 5 of the anosmic patients (12.5%) had a higher discrimination score and 35 (87.5%) had a lower discrimination score. Univariate analysis showed that those with a lower discrimination score had a higher polyp grading score than those with a higher discrimination score (p<0.05), but no significant relationships were found in multivariate analysis (Table 6).
Next, we assessed whether there were any significant risk factors related to identification scores in anosmia patients (Table 7). We found that, among anosmic patients, 9 patients (22.5%) had a higher identification score and 31 patients (77.5%) had a lower identification score. The polyp grading score was higher in the lower identification score group than in the higher identification score group (p=0.01). Smoking (p=0.08), Lund-Mackay score and the POCS tended to influence the threshold (p=0.08) in univariate analysis (Table 7). However, in multivariate analysis, the difference in the polyp grading score between the high and low identification score groups, and only the POCS significantly affected the identification scores (p<0.05).
Discussion
Since olfactory function is a complex concept that includes olfactory threshold, identification, and discrimination, deterioration of olfaction does not simply mean reduction of the olfactory threshold, and patients with an apparent similar degree of olfactory dysfunction and similar risk factors may differ in their olfactory threshold, identification, and discrimination. Therefore, we investigated the risk factors for poor olfactory threshold, discrimination, and identification scores as well as correlations among these domain scores. Although it shows a weak tendency, we found significant correlation among these scores only in hyposmic, but not anosmic individuals; as the olfactory threshold increased, olfactory discrimination and identification decreased, and odor discrimination and identification were positively correlated with each other (Fig. 2). Furthermore, in hyposmic individuals, olfactory threshold was related to age rather than to CRS severity (Table 2), while in anosmic patients, CRS severity as determined by POCS on CT was significantly related to threshold scores in anosmic patients (Table 5). In terms of odor identification, we showed that identification scores were related to AOCS on CT in hyposmic patients (Table 4), but to POCS on CT in anosmic patients (Table 7). However, we could not find any statistically significant risk factor for odor discrimination in either hyposmic or anosmic patients in multivariate analysis (Tables 3 and 6). To our knowledge, no previous study has assessed the risk factors for each domain of the olfactory function test (threshold, discrimination, and identification) in CRS patients with hyposmia and anosmia to date.
Olfactory neurons are present in the form of neuroepithelial cells along the superior and middle turbinates and the upper part of the nasal septum [20]. Olfactory receptor neurons are replaced by new neurons during adulthood, in the form of bipolar cells [20]. The number of sensory neurons, including odorant-selective receptor cells and first-order neurons, decrease with age and deterioration is more prominent after the age of 65 years [20,21]. Decreased olfactory function is common in old age, occurring in more than 50% of elderly individuals aged 65-80 years and in 62-80% of those aged 80 years or older [22]. This may be due to problems associated with non-olfactory systems, including age-related atrophy of the nasal epithelium, a decrease in mucosal blood flow, and reduction in the foramina in the cribriform plate, and to problems associated with the olfactory system per se, including degeneration of the olfactory neuroepithelium and olfactory bulb [23]. In demographic analysis, unlike other studies, we found no significant difference in age or sex between hyposmic and anosmic patients in this study (p>0.05). Interestingly, the hyposmia group had higher nasal endoscopic item scores than the anosmia group, with the exception of the scarring score. To date, many studies have shown that poorer nasal endoscopy scores and higher CT severity scores are associated with a decreased olfactory threshold and worse odor identification [9]. One possible explanation for this discrepancy is that nasal endoscopy reflects the overall status of the nasal cavity rather than the status of only the olfactory cleft, which contains the olfactory nerve. Further studies comparing specified endoscopic findings of the olfactory cleft are warranted. In contrast, both olfactory cleft opacification scores were higher in the anosmia than in the hyposmia group, in agreement with a previous study [8].
We used the KVSS II, which is a validated full olfactory function test [24] commonly used to evaluate olfactory thresholds, odor discrimination, and odor identification. We noticed the variability of the domain scores particularly in hyposmic individuals in this study. Moreover, we found a significant correlation among the components of the olfactory function tests only in patients with hyposmia, and showed that olfactory threshold was negatively correlated with olfactory discrimination and identification, while odor discrimination and identification were positively correlated with each other (Fig. 2). In a previous hyposmia study, the ability to identify odor was shown to affect the ability to remember the odor [25]. Additionally, the odor discrimination test aims to evaluate the ability to distinguish different odors after memorizing the odors; thus, this memorizing ability affects the olfactory identification test outcomes [22]. Therefore, the olfactory function of hyposmic patients appears to be influenced not only by the olfactory threshold, but also by the ability of the patient to memorize odors, which involves odor discrimination and identification. Given these findings, it might be helpful to evaluate memory ability in addition to performing olfactory function tests in future studies. However, in anosmic patients, we could not find any relationship among the three components of the KVSS II test. As shown in Fig. 2 and Table 1, the overall scores of threshold, discrimination, and identification were low, unlike those in hyposmic patients.
Because the olfactory neuroepithelium is mostly distributed in the olfactory cleft, chronic inflammation of this cleft is involved in sensorineural olfactory dysfunction as well in conductive olfactory dysfunction, by damaging the olfactory epithelium [12]. Several studies have shown that the more severe the opacification of the preoperative olfactory cleft, the lower the recovery rate of olfactory function after surgery [26,27] The anterior olfactory cleft is considered important clinically because it affects air flow to the overall olfactory cleft and the olfactory epithelium is predominantly distributed in the anterior region [27,28]. Olfactory thresholds were shown to be positively correlated with the anterior and posterior portions of the olfactory cleft, with the anterior portion showing a stronger correlation than the posterior portion [25]. Similarly, we found that the olfactory threshold was related to the AOCS on CT in patients with hyposmia (Table 4). Additionally, olfactory threshold and identification were significantly related to POCS on CT in anosmia (Tables 5 and 7).
Furthermore, although age affects deterioration of olfactory function, we found that olfactory dysfunction in anosmic patients was related to CT severity of CRS, rather than to age. Contrary to anosmia, interpretation of the results for the hyposmia group was more complicated. Threshold increased with age, and identification was associated with CRS severity in terms of opacification of the anterior olfactory cleft. This was inconsistent with the finding that olfactory function deteriorates with age. The reason for this finding was not clear, but the mean age of the 120 patients in our study was 51.9 years, which is relatively young, and only 19 patients (15.8%) were older than 65 years. In addition, since all patients had CRS, CRS may have been a confounding factor.
This study had several limitations. First, since only CRS patients, but no control subjects, were enrolled, there was a limitation in terms of evaluating age-matched olfactory function. Second, we enrolled the patients who received surgery and we did not include patients with CRS who did not received surgery. Third, we included demographic features, such as age, sex, alcohol or smoking history and disease features, including CRS severity measured by CT scan and endoscopic evaluation. However, olfactory function could be affected by structural nasal factors, such as nasal septal deviation and hypertrophy of the turbinate, as well as other comorbidities. Further studies including more variables are warranted for further comprehensive analysis. Another potential limitation could be the relatively small number of subgroup patients among the anosmic patients. Future studies with a sufficient number of subjects with anosmia are needed to verify our results.
In conclusion, the results of this study demonstrated that there are correlations among the three components of the olfactory function test in CRS patients with hyposmia. Furthermore, among the risk factors, age affects threshold scores, while CRS severity determined by AOCS on CT is associated with identification scores in hyposmia patients. In CRS patients with anosmia, CRS severity determined by POCS on CT affects threshold and discrimination scores. These findings would facilitate understanding of the pathophysiology of CRS-related olfactory dysfunction.